

We store historical data from terrestrial AIS stations dating back to 2009. The AIS data has a great value for vessel traffic analyses, port calling information and all services related to vessel movements and their behaviour.
Operating hundreds of terrestrial AIS stations worldwide VT Explorer has become one of the leading providers of historical AIS data as of 2009.
Historical AIS data is used for analyzing vessel movements on a global scale, investigating ship accidents or illegal ship-related activities, exploration of port calls or efficiency of port activities and much more.


Traffic Density Analysis
Analysis of the traffic density and vessels behavior in critical areas
Vessel Movements Report
This service provides data about the position of thousands of ships around the world collected by terrestrial AIS stations since 2009. Vessel Movements report is primarily used for:
- tracking the historical route of one or more vessels
- exploring the movements of all vessels in a specific port/area
Delivered data:
- Access to the Voyage Analyser service, so you can explore the vessel movements
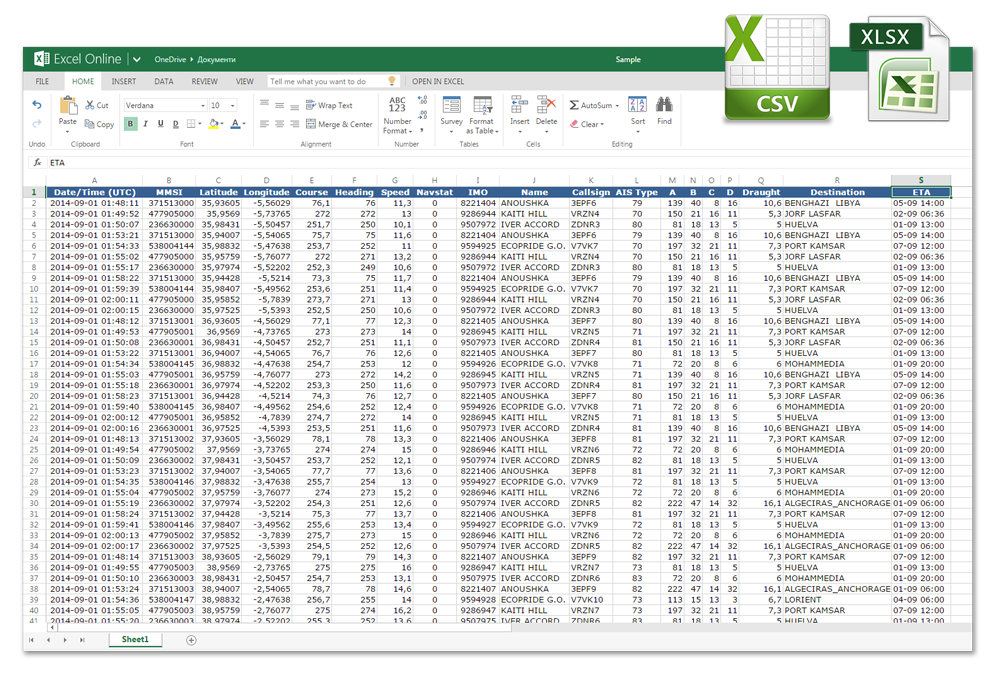
- Report in XLS/CSV format with all data fields described below
With the Voyage Analyser service, you can explore the movements of every vessel you have purchased data for in more details. Еasily analyse the vessel’s course, speed, and draught at each reported position. Find out the average and maximum speed the vessel sailed at through the studied time range along with detailed information about its draught changes over the time.
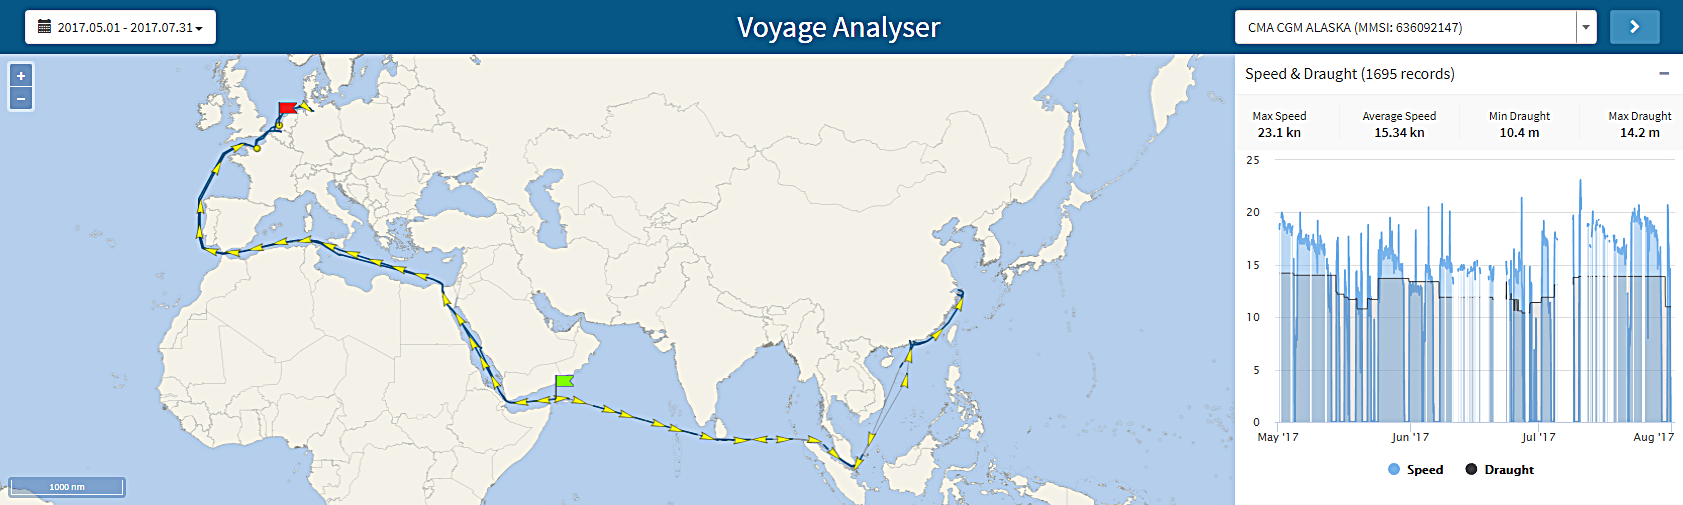
Voyage Analyser Sample
For each ship position we deliver:
- Latitude & Longitude
- Date and Time in UTC (GMT)
- Vessel IMO number
- Vessel MMSI number
- Course over ground
- Speed over ground
- Heading
- AIS type
- Callsign
- Dimensions (length and width)
- Draught
- Destination
- ETA (estimated time of arrival)
Sample movements report of tanker ship “GLOBAL URANUS”
Data is delivered in raw NMEA format or in CSV/XLS format.
Additional vessel parameters may be provided such as flag, gross tonnage, deadweight, manager, owner, etc.
The data frequency depends on the requested time interval and customer’s requirements.
Port Calls
This service provides information about the visited ports by a specific vessel/s or all vessels that have visited specific port/s. A Port Call is registered whenever a vessel enters/leaves the port area. The Port Calls service is used for:
- finding the ports visited by specific vessel/s
- finding all vessels that have visited specific port/s or other area
For each port call we deliver:
- Latitude & Longitude
- Date and Time in UTC (GMT)
- Vessel Name, IMO and MMSI number
- Event type (Enter or Exit)
- Port Name & Locode
Data is delivered in CSV or XLS format.
Additional vessel parameters may be provided, such as flag, gross tonnage, deadweight, manager, owner, etc.
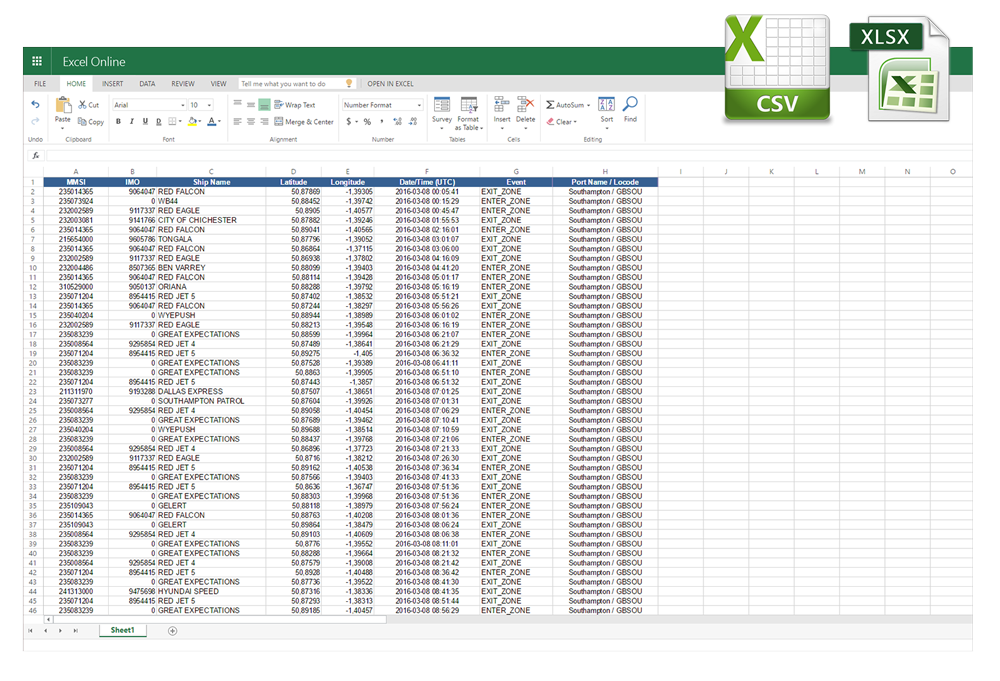
Sample Port Calls report for port Southampton, UK
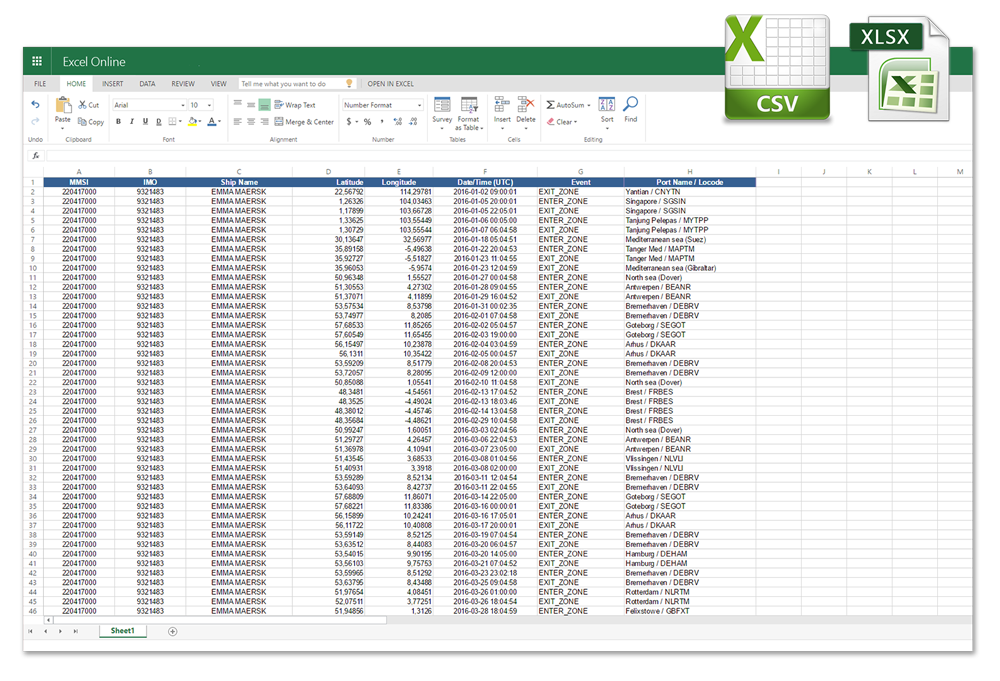
Sample Port Calls report for container ship “Emma Maersk”
Video Simulation
This service uses historical AIS data to reproduce a simulation of the vessels’ movements on a digital map. The Video Simulation service is ideal to:
- investigate an accident
- explore the movements of vessel/s in a specific area
- analyse vessel behaviour patterns for potential prosecution of illegal actions, such as illegal ballast water exchange or illegal bunkering
Data is delivered in raw NMEA format or in CSV/XLS format.
Additional vessel parameters may be provided by request.
Delivered data:
- Timestamped historical AIS data used to to produce the video simulation
- Video simulation file in AVI format

Traffic Density Analysis
Historical AIS data make the analysis of traffic density and vessel behavior in critical areas possible. Density analysis is performed for specific area and additional criteria such as ship type, size, year could be applied.
The Traffic Density analysis is used for:
- risk assessment and exploration of the efficiency of port services
- analyzing of shipping traffic and trend patterns
Data delivered:
- Traffic density images
- Georeferenced KML file
- Entire AIS data set used to perform the analysis
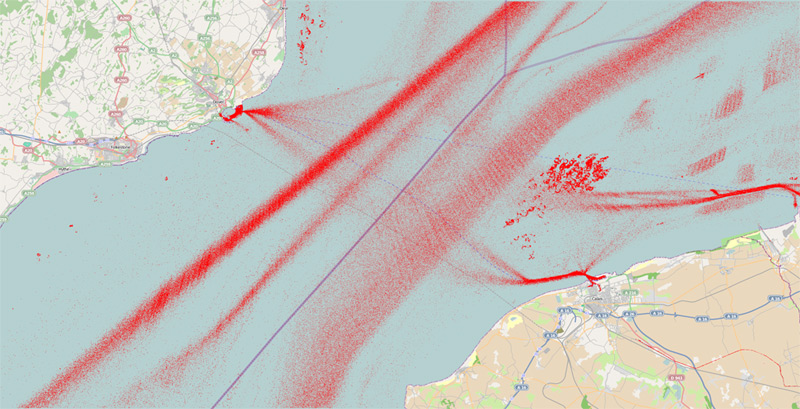
Sample Traffic Density Analysis of DOVER - CALAIS area Q1/2012

Sample Traffic Density Analysis of DOVER - CALAIS area Q1/2012
Historical AIS Data Request
The price for historical AIS data depends on the requested amount thereof, its frequency and all additional information related thereto.
Send us more information about your needs and we will respond with relevant pricing and data availability in short time.